TL;DR: Amazon stock and price tracking connects inventory availability with pricing decisions. Start with your own sellable units, sales history, and replenishment dates; then compare competitor prices and availability under consistent conditions. Check stock coverage and contribution margin before changing prices, promotions, or advertising. A public availability observation is useful market context, not a complete count of a competitor's inventory.
Key Takeaways
- Track the inventory you can actually sell. Separate available units from inbound, reserved, and unsellable stock, and check whether the offer is active.
- Compare like-for-like offers. Keep the ASIN, variation, seller, condition, shipping destination, and promotion conditions consistent.
- A price change can alter replenishment needs. Recalculate coverage when demand changes rather than using the same sales assumption indefinitely.
- More unit sales do not automatically mean more contribution. Model the discounted price, variable costs, and additional campaign costs before matching a competitor.
Table of Contents
- Quick Answer: What Is Amazon Stock and Price Tracking?
- What to Track: Your Inventory vs. Competitor Availability
- Compare the Same Offer Before Comparing Prices
- Read Inventory, Price, and Demand Together
- Turn Stock Levels Into Replenishment Decisions
- Protect Margin Before Matching a Price Drop
- A Practical Stock and Price Tracking Workflow
- How SellerSprite Supports the Workflow
- Common Mistakes and Pricing Guardrails
- The Bottom Line
- FAQs
- References
Marketplace note: This guide focuses on Amazon US inventory and offer pricing. Use your own inventory records for replenishment decisions, and check each research tool's coverage and update timestamps. The calculations below are planning examples, not Amazon-defined targets.
Quick Answer: What Is Amazon Stock and Price Tracking?
Amazon stock and price tracking means monitoring product inventory, offer availability, and selling prices over time to support replenishment, pricing, and advertising decisions. For your own products, start with sellable inventory, confirmed incoming stock, lead times, and actual sales. Use competitor observations to understand the market, not to replace your inventory records.
The two decisions are connected: a promotion can consume inventory faster, while limited stock can make additional discounting unhelpful. Amazon also identifies stock availability and total price as factors in the Featured Offer, the offer associated with the Add to Cart or Buy Now buttons.
Start with the constraint: Is the immediate problem insufficient available stock, weak demand, an uncompetitive offer, or an unprofitable selling price? The same price change can be sensible in one situation and costly in another.
What to Track: Your Inventory vs. Competitor Availability
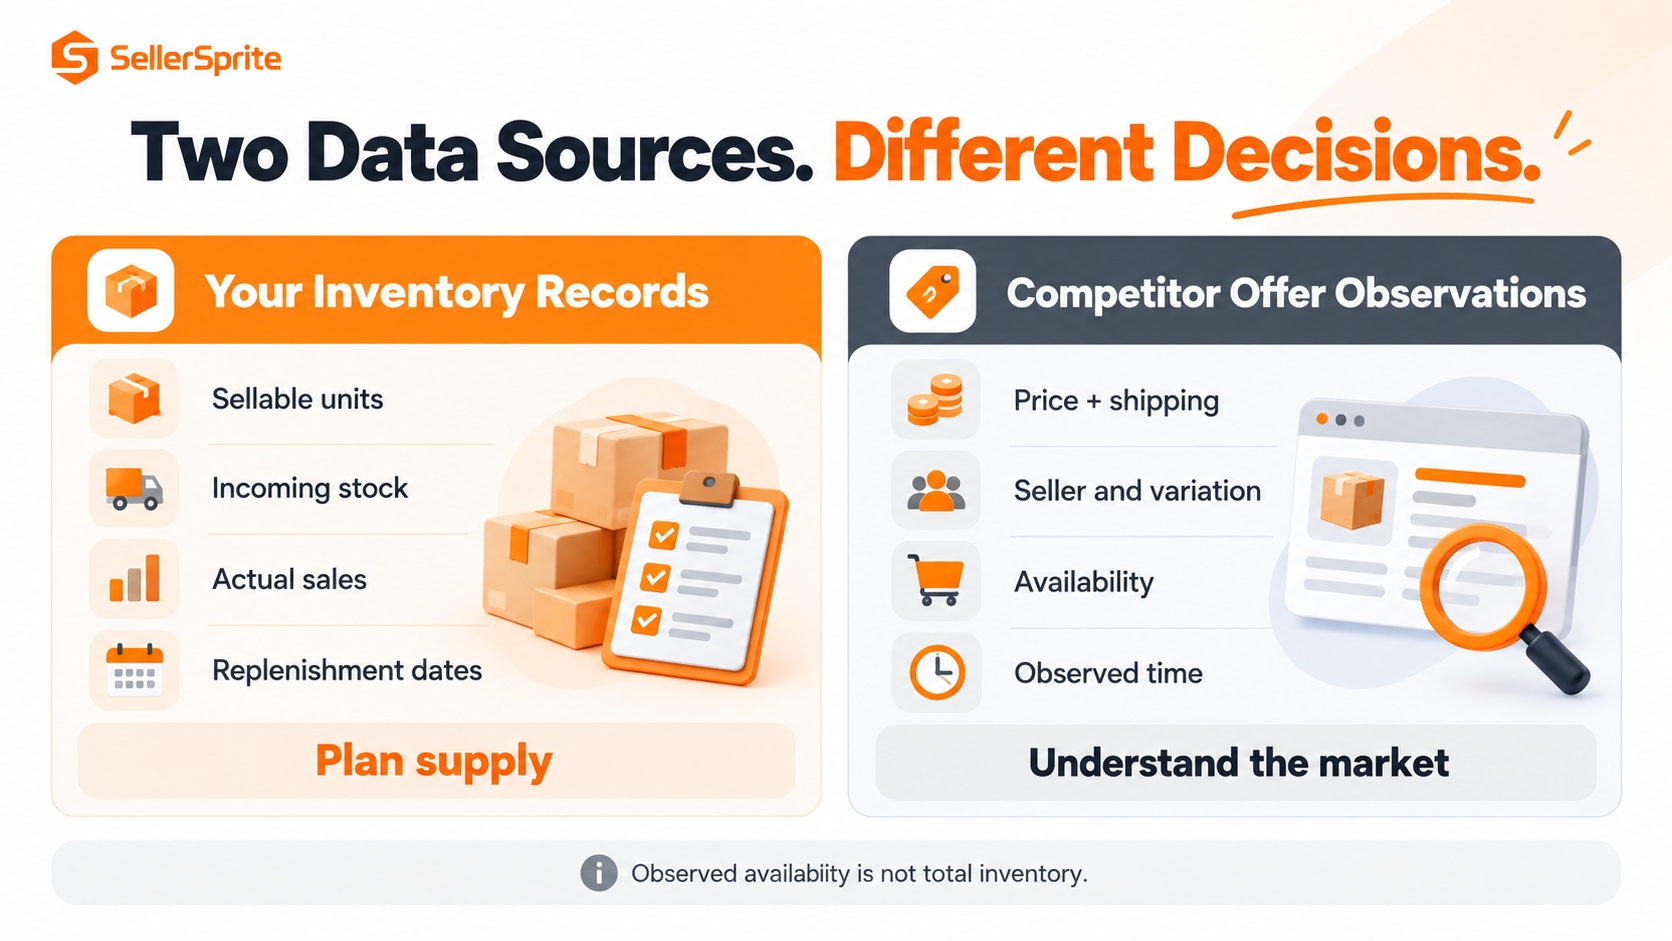
Your own inventory and a competitor's visible offer answer different questions. Keeping those datasets separate prevents a public listing observation from being mistaken for an operational stock count.
Your Inventory: Available Units, Incoming Stock, and Offer Status
Amazon's FBA inventory documentation distinguishes fulfillable, inbound, reserved, unfulfillable, and researching quantities. These categories describe different operational states, so a combined stock total should not be treated as units ready for immediate fulfillment.
| Stock state | What it represents | Planning treatment |
|---|---|---|
| Fulfillable / available | Units ready for fulfillment under the relevant inventory definition. | Use the applicable available quantity for near-term coverage. |
| Inbound | Units progressing toward Amazon's fulfillment network. | Track expected sale-ready dates; do not count as available today. |
| Reserved | Units allocated to orders or held for processing. | Review the reason before treating them as future supply. |
| Unfulfillable | Units not in sellable condition. | Exclude from sellable coverage until their status is resolved. |
| Researching | Units under investigation, such as misplaced or damaged units. | Do not assume they will become available on a specific date. |
There is a separate offer-status issue: stranded inventory can be physically present in a fulfillment center without an active offer. Amazon's inventory buyability guidance explains why stock in the network may still be unavailable to customers. Diagnose the listing or inventory status before deciding to buy more units.
For merchant-fulfilled products, reconcile your warehouse or logistics-provider records with open orders and stock allocated to other channels. Count a unit once, and use the report's definition to avoid subtracting an order reservation that is already excluded from available stock.
Competitor Availability: Observe the Offer, Not an Entire Supply Chain
Record which offer is available for the selected variation and delivery destination, along with the observation time. Amazon notes that location, delivery preferences, and Prime membership can affect the Featured Offer a customer sees. A different offer appearing is not proof that the previous seller has zero units everywhere.
Keep statements narrow: "this seller's offer was unavailable under these conditions" is more defensible than "the competitor ran out of inventory." Any quantity inferred from public offer behavior needs the method's limitations attached to it.
Compare the Same Offer Before Comparing Prices
A price history is only comparable when the underlying offer remains comparable. Before reacting to a change, check whether you are still observing the same product configuration and seller.
- Product identity: marketplace, child ASIN, variation, pack size, and condition.
- Offer identity: seller and fulfillment method; distinguish a specific seller's offer from the Featured Offer.
- Price basis: item price, shipping, and any separately recorded coupon or promotion.
- Observation context: date, time zone, destination, membership conditions, and data source.
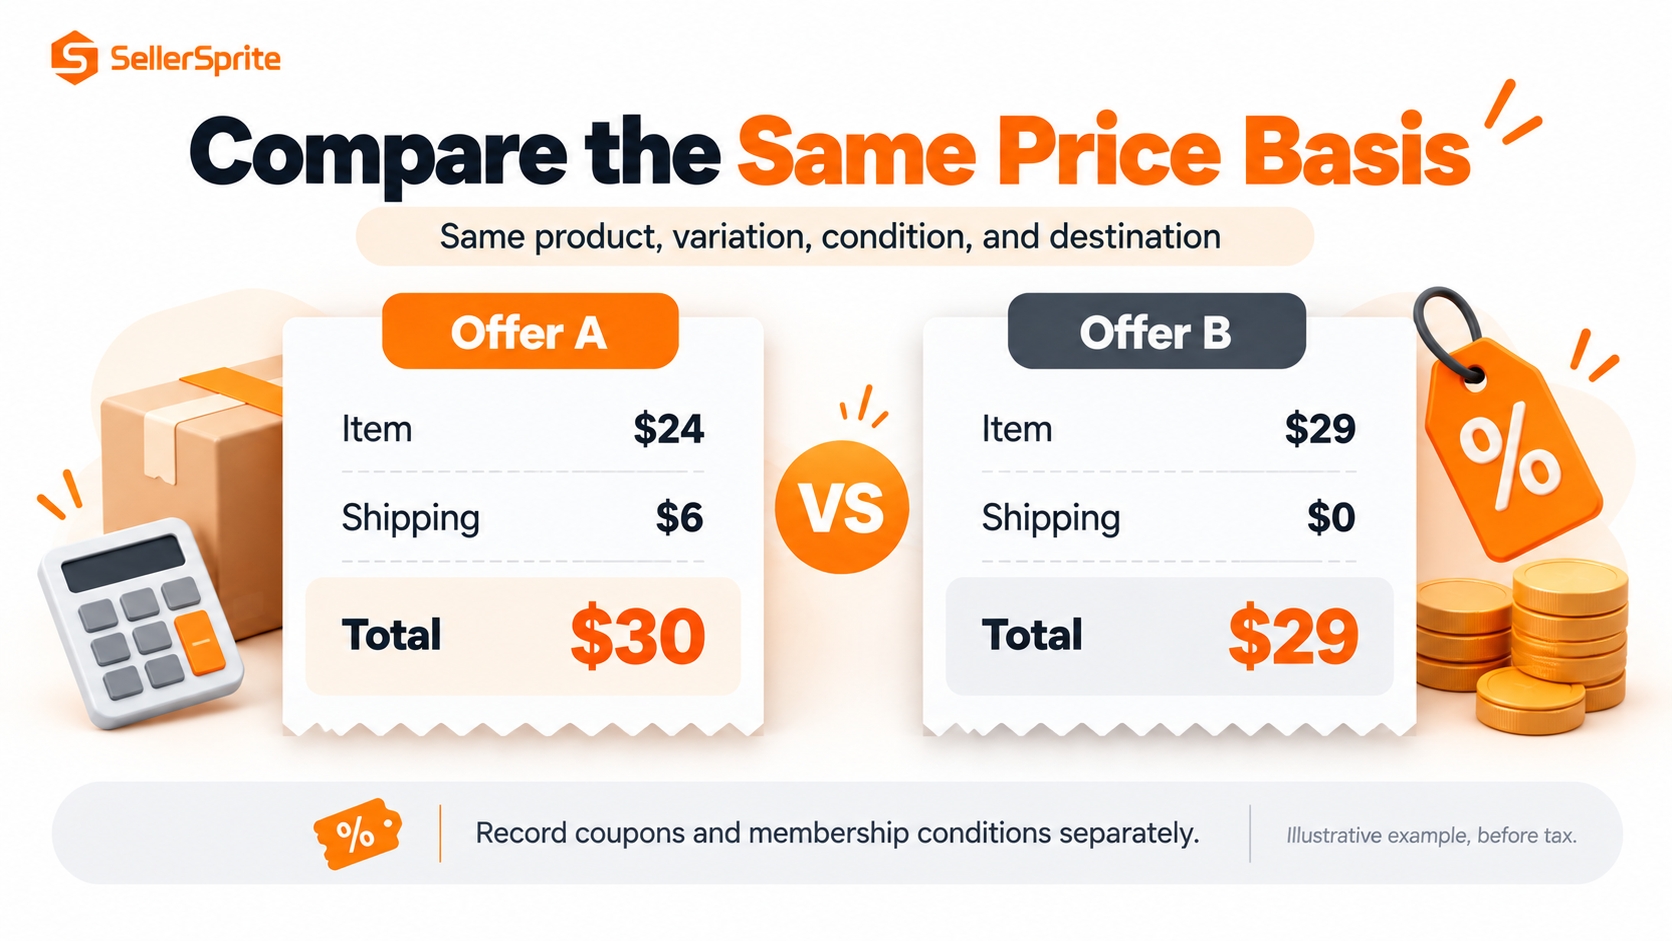
Amazon defines total price for Featured Offer comparison as item price plus shipping. Keep conditional savings separate from that base comparison, and use the same tax basis across observations. A coupon price available to one eligible shopper should not silently replace a generally visible offer price in your dataset.
For example, a hypothetical $24 item with $6 shipping and a $29 item with free shipping are $30 and $29 before tax. The lower headline price is not the lower delivered price. Likewise, if a different seller takes the Featured Offer, the chart may move even though the original seller did not change its own price.
Review historical ranges and promotion periods rather than treating today's lowest price as the market's normal price. SellerSprite's guide to reading Amazon price history provides additional context on evaluating historical price-tracking tools.
Read Inventory, Price, and Demand Together
Price, availability, and sales can change together without having one simple cause. Use a timeline of observations to develop a hypothesis, then test that explanation against your own operations and comparable offers.
Best Sellers Rank, or BSR, is a relative sales rank within a category, not an exact unit-sales count or an inventory quantity. Amazon also distinguishes BSR from search ranking. Use BSR and third-party sales estimates as context; use your own order records for your actual sales.
| Observed pattern | Possible explanation | Check before acting |
|---|---|---|
| Your available stock falls while sales accelerate. | A promotion, seasonal demand, or improved visibility may be consuming supply faster. | Recalculate coverage and the next credible replenishment date. |
| A competitor's offer disappears and the visible price rises. | Another seller or a different offer may now be displayed. | Recheck seller, variation, destination, and other offers. |
| Your price falls but sales remain weak. | Price may not be the main barrier. | Inspect availability, delivery, listing clarity, and traffic quality. |
| Recorded warehouse units remain high but the offer cannot be purchased. | Stock may be unavailable operationally, or the offer may be inactive. | Check inventory status and buyability before replenishing. |
These are investigation prompts, not proven causal relationships. If pricing, advertising, and availability all changed during the same period, the data cannot isolate the effect of the discount alone.
Turn Stock Levels Into Replenishment Decisions
Inventory tracking becomes useful when it answers a timing question: will usable supply last until the next replenishment becomes available? Amazon's inventory-management guidance emphasizes balancing stock, reordering, and the costs of excess or insufficient inventory; the simplified calculations below translate that principle into a planning exercise.
Estimate Coverage Using a Relevant Demand Assumption
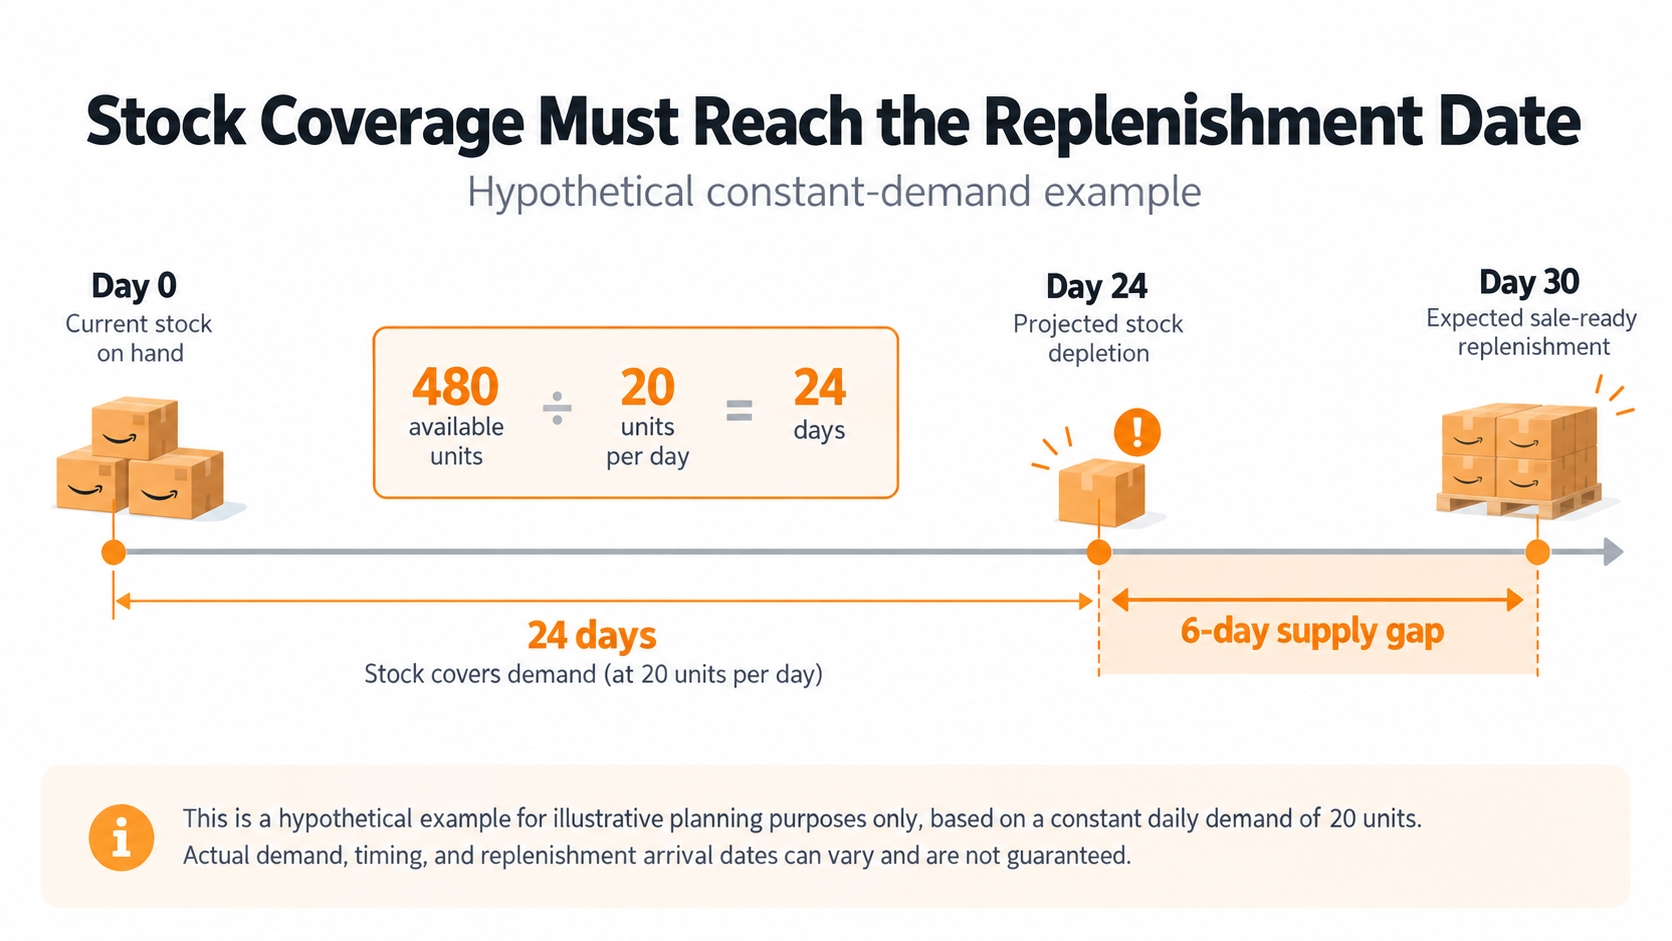
Days of stock coverage = available sellable units ÷ expected daily unit demand
Use actual in-stock sales periods as a starting point, then adjust the expectation for known promotions and seasonality. Including many out-of-stock days in the average can understate the demand you would have served. If expected daily demand is zero or unreliable, do not treat the formula as a useful coverage estimate.
Compare Coverage With the Full Replenishment Lead Time
Measure lead time through the point when units are expected to be sale-ready, not merely dispatched by a supplier. Include the relevant preparation, transport, receiving, and processing stages, and keep uncertainty visible.
Simplified reorder point = expected daily demand × replenishment lead time in days + safety stock in units
Use this as a planning trigger, not a universal Amazon rule or an automatic order quantity. Compare it with your inventory position, including usable on-order stock and commitments without double-counting. Then check arrival dates separately: a shipment due after projected depletion cannot prevent the earlier gap.
Worked Example: A Stockout Risk Before the Shipment Arrives
Hypothetical assumptions: 480 available units, expected demand of 20 units per day, a 30-day replenishment lead time, 120 units of safety stock, and no earlier confirmed incoming supply.
- Coverage: 480 ÷ 20 = 24 days.
- Reorder point: (20 × 30) + 120 = 720 units.
- Timing gap: existing supply is projected to run out six days before replenishment is sale-ready.
The next action is to review supply timing and avoid blindly accelerating demand. Confirm earlier supply options, reconsider a planned discount, or reduce discretionary advertising where appropriate. If demand rises to 30 units per day, the same 480 units cover only 16 days; yesterday's coverage estimate is no longer the right decision input.
Protect Margin Before Matching a Price Drop
A competitor's discount is a reason to recalculate, not an instruction to imitate. Calculate your expected contribution at the new price before assuming additional volume will compensate for a smaller return per unit.
Contribution per unit = net selling revenue per unit − variable costs per unit
Include landed product cost, applicable selling and fulfillment fees, advertising, promotion costs, and realistic return or handling allowances. Use current fees for the actual product and fulfillment method; Amazon's referral fees vary by category. Count each cost once, and keep fixed campaign costs and overhead separate from this per-unit calculation.
Illustrative model, not an Amazon fee quote: assume a proportional fee of 15% of the net selling price and $15 of other variable costs per unit. The $15 includes all other costs used in this example, with no separate fixed campaign fee.
| Input or result | Original price | Reduced price |
|---|---|---|
| Net selling price | $30.00 | $25.00 |
| Assumed proportional fee: 15% | $4.50 | $3.75 |
| Other variable costs per unit | $15.00 | $15.00 |
| Contribution per unit | $10.50 | $6.25 |
Under these assumptions, maintaining the same total contribution requires $10.50 ÷ $6.25 = 1.68 times as many units, or 68% more unit sales. That is a break-even volume comparison, not a demand forecast. If advertising costs, return costs, or fixed promotion charges increase, the result changes.
For a deeper explanation of the two calculations, see SellerSprite's guide to sales estimates versus profit calculations. An attractive sales estimate does not establish that a particular selling price is profitable.
A Practical Stock and Price Tracking Workflow
Build a small, repeatable process around decisions rather than collecting every available metric. The workflow below preserves a clear record of what changed, how it was verified, and what action followed.
- Define the decision and product scope. Select your own SKUs and the relevant competitor child ASINs; separate same-ASIN offer competition from comparable-product research.
- Create a consistent baseline. Record your available units, actual sales, price, costs, lead times, and dated competitor observations before interpreting a change.
- Label data by source and timing. Distinguish owned inventory records, observed offer data, and modeled sales estimates. Do not compare a monthly estimate with a daily order count as though they share a time window.
- Set decision thresholds. Examples include coverage below replenishment needs, a verified comparable price outside its historical range, or contribution below your internal floor. These are business thresholds, not platform standards.
- Verify the signal before execution. Check current stock status and the actual offer, review active promotions, and confirm the data is fresh enough for the action.
- Assign an action and review date. Record whether you replenished, corrected an offer, changed advertising, tested a price, or deliberately held steady. Recheck both availability and contribution afterward.
Review constrained or actively promoted SKUs more often than stable products. A daily check can be a starting routine, with additional checks during a fast-moving issue; it is not a claim that every data source refreshes daily or that every price alert deserves an immediate response.
How SellerSprite Supports the Workflow
SellerSprite combines historical market research, on-page competitor inventory checks, and ongoing price monitoring. Use Stock Status to inspect inventory on Amazon product pages, Product Tracker to follow selected ASINs, and Keepa Trends to put price changes into historical context, while keeping your own inventory and cost records as the basis for replenishment decisions.
Product Research: Establish the Market Baseline
Use Product Research to compare candidate products and historical movements in sales, price, BSR, and other supported fields. Its historical and comparison views can help you distinguish a seasonal pattern from a recent change before choosing which ASINs to monitor.
Stock Status: Check Competitor Inventory on the Product Page
The SellerSprite extension's Stock Status feature displays an ASIN's real-time inventory information directly on the Amazon product detail page, together with details of sellers offering that product. View the remaining stock shown for the displayed offers alongside seller names and prices to compare competing offers without leaving the listing.
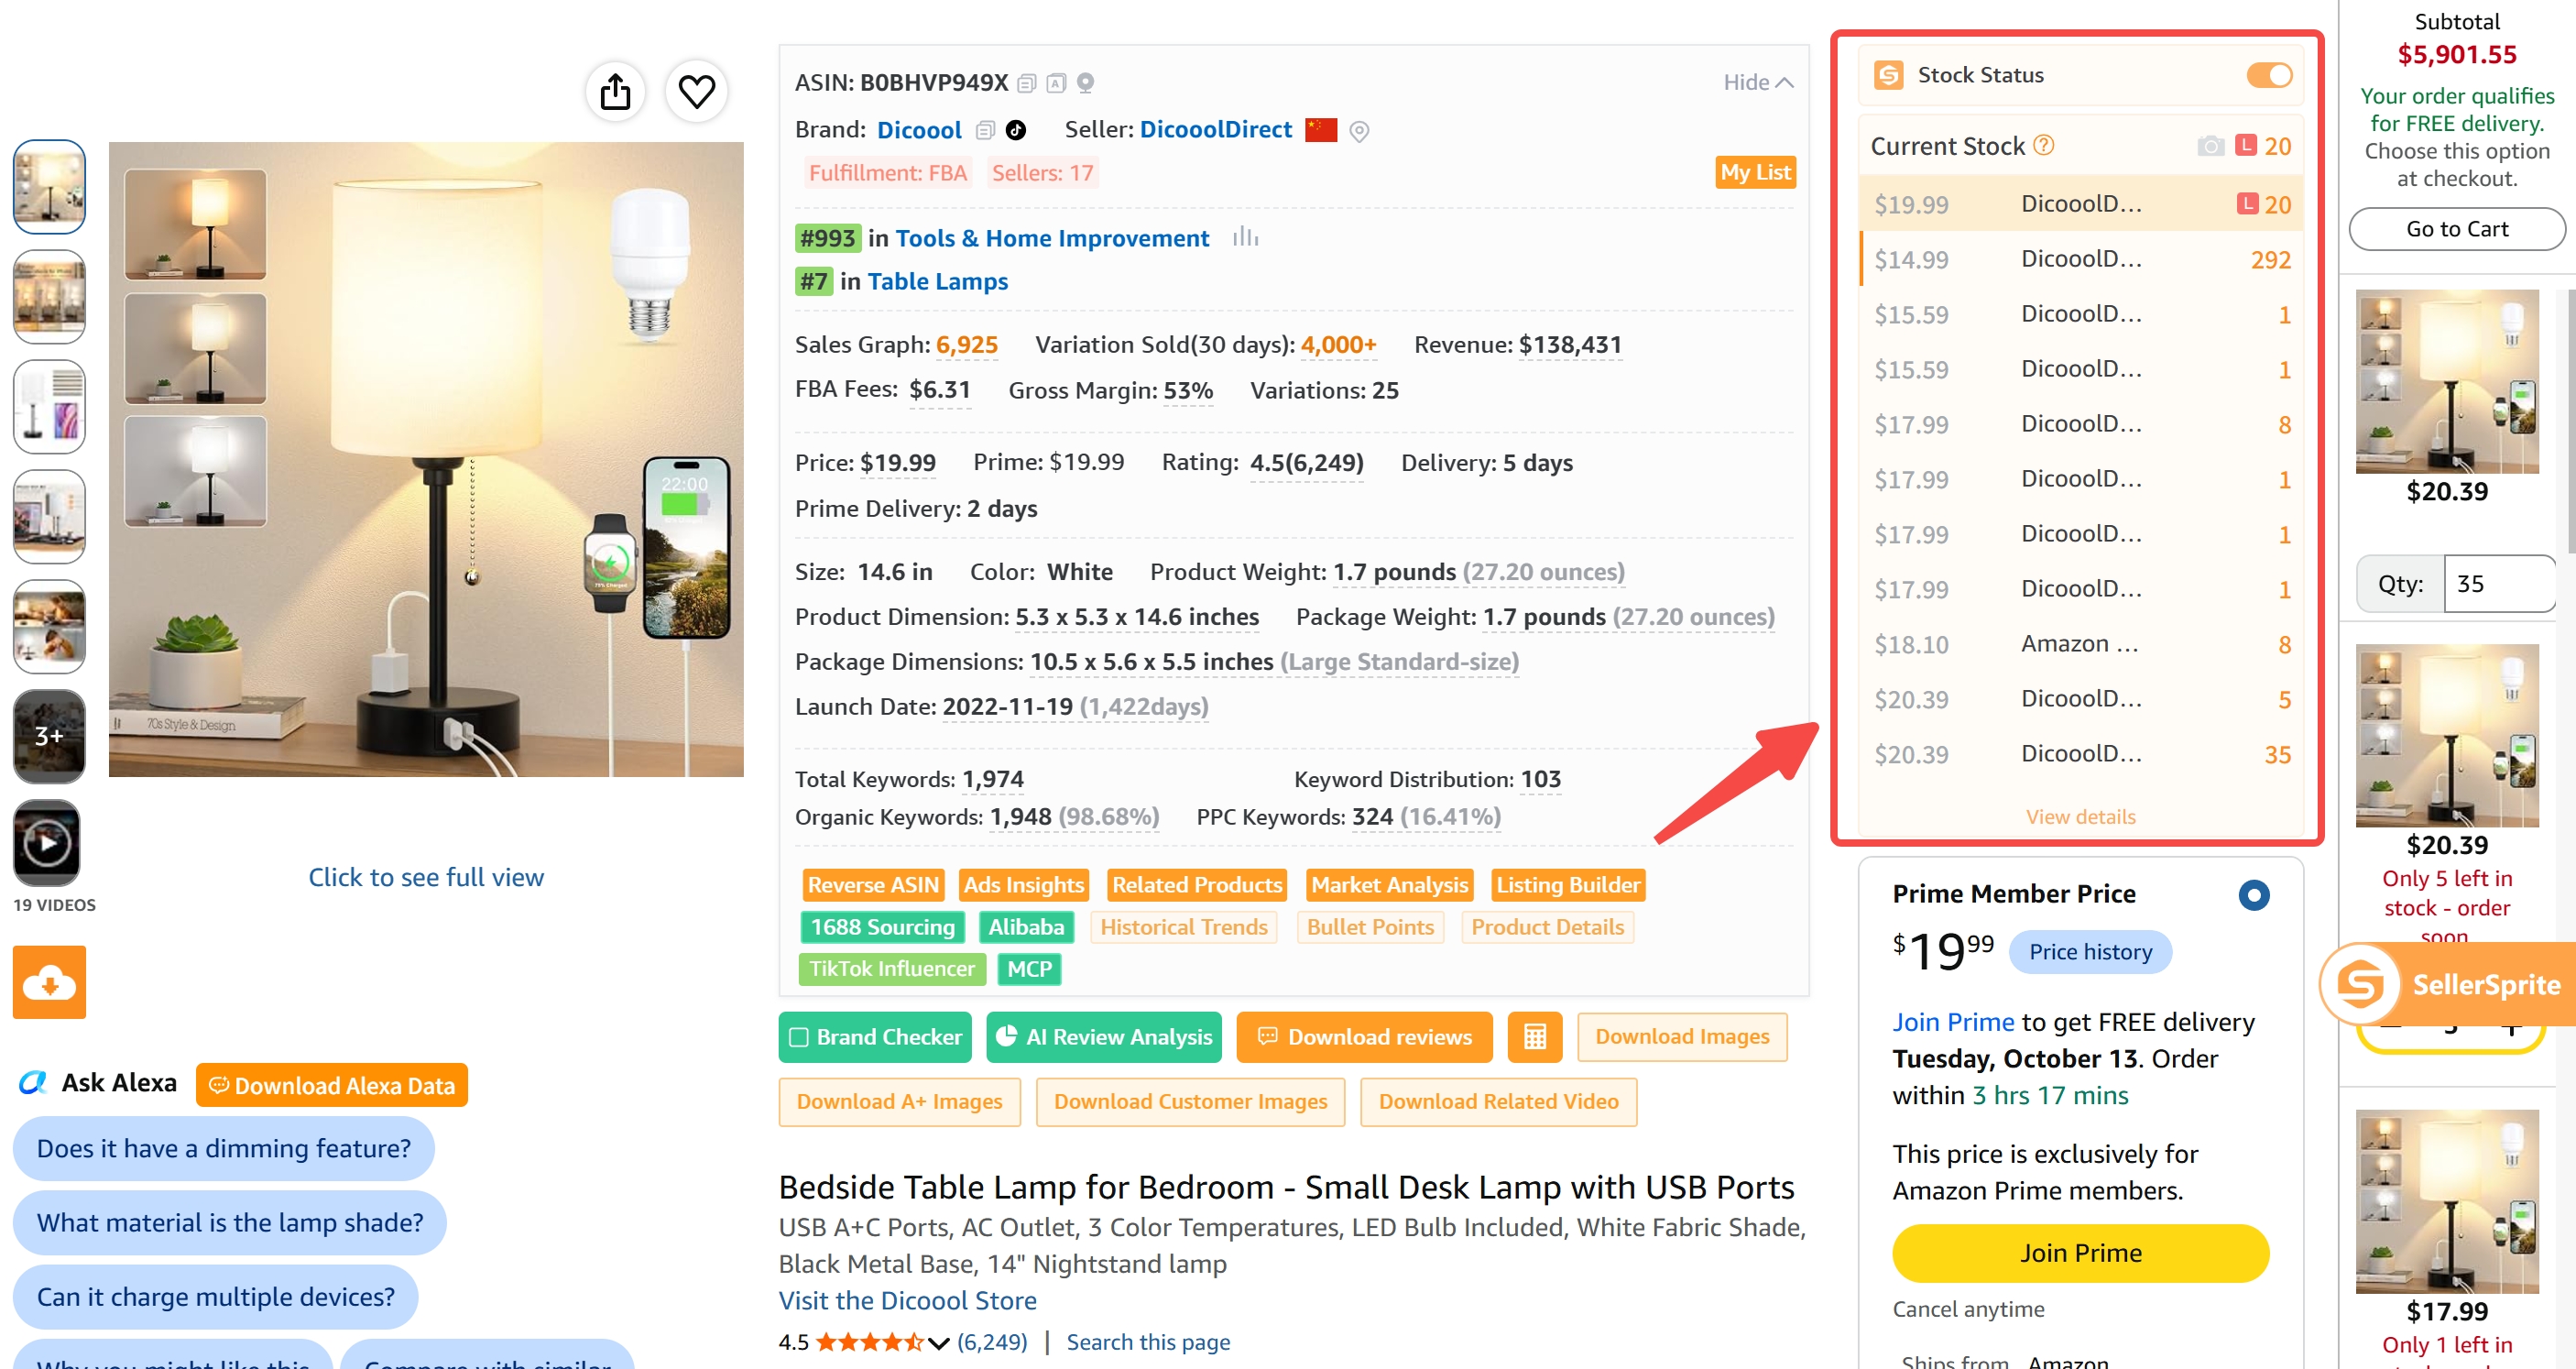
Use this as an on-page check of competitor stock and offer conditions when a basic in-stock or unavailable label does not provide enough context. Before comparing two readings, confirm that you are looking at the same seller and fulfillment method.
Stock Status limitations: Inventory monitoring may be unavailable or produce distorted results in the following situations:
- The Buy Box owner changes.
- The current inventory count is higher than the previous count, such as after replenishment or returns.
- The fulfillment method changes, for example from merchant fulfillment (FBM) to Fulfillment by Amazon (FBA).
- The product has a purchase-quantity limit.
- Inventory exceeds 999 units.
Treat these readings as competitor inventory observations, not a complete stock ledger. Do not interpret every difference between readings as completed sales; recheck offer changes and the limitations above before making a pricing or replenishment decision.
Product Tracker: Monitor Prices Across Selected ASINs
Use Product Tracker for ongoing price monitoring of selected ASINs, alongside supported product signals such as ratings and BSR. Keep a focused set of products relevant to your inventory or pricing decision so you can compare changes over time rather than repeatedly checking isolated prices.
Pair it with Keyword Tracker when you want to compare product-price changes with keyword-position changes.
Keepa Trends: Review Historical Price Changes in the Extension
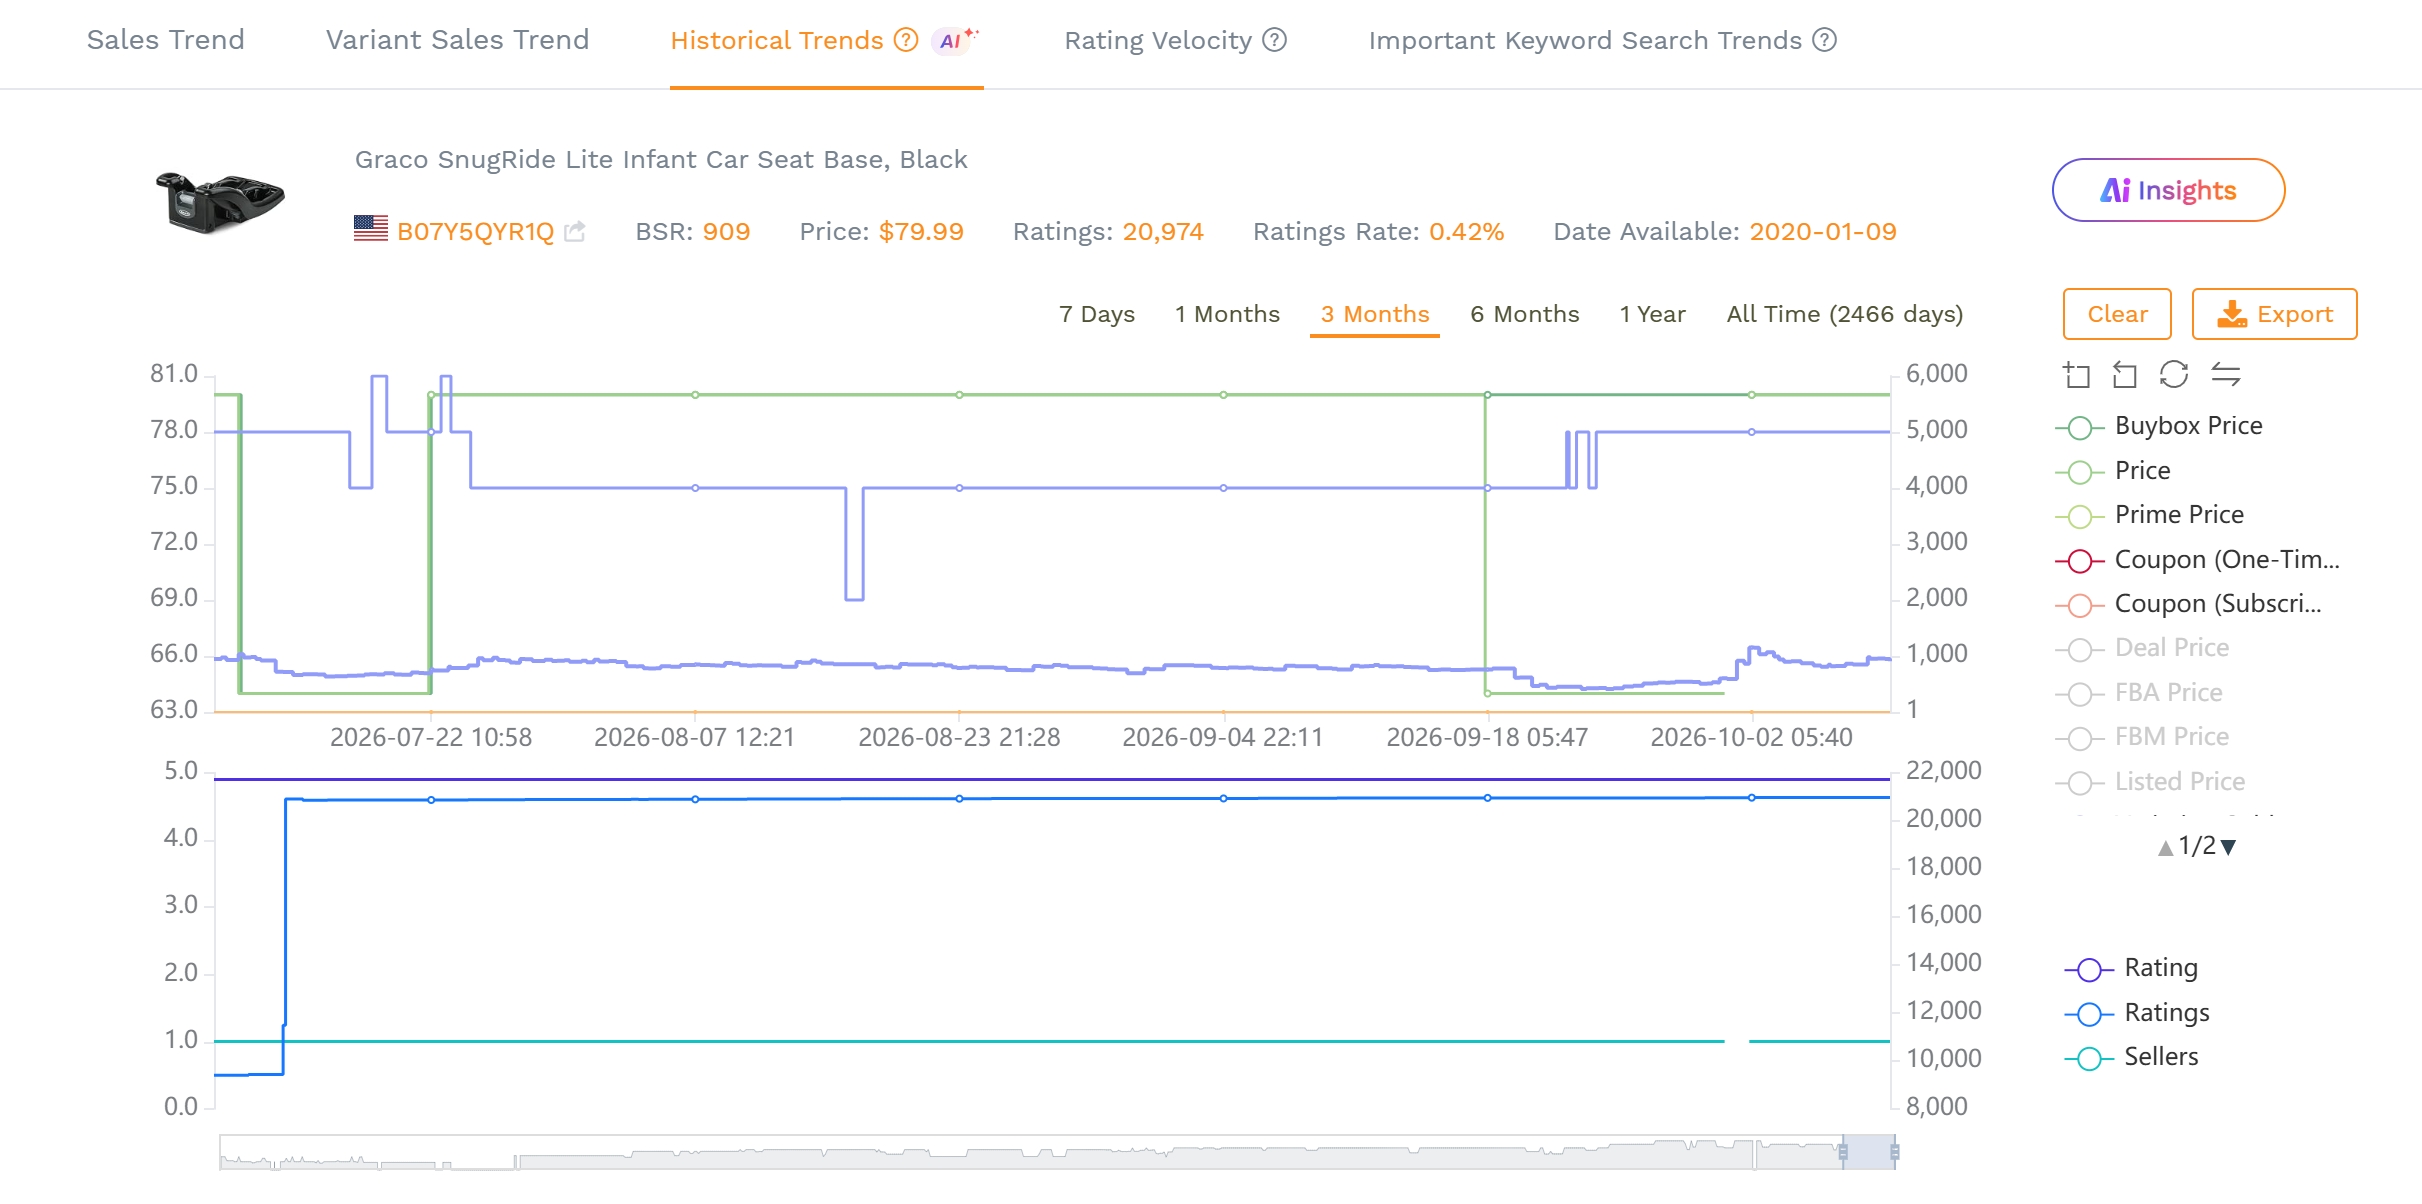
Keepa Trends also supports price tracking through historical charts in the SellerSprite extension. On a product listing, open the extension's data panel and select Keepa Trends to review price changes over the available time ranges alongside BSR and other listing metrics.
Use available series such as Buybox Price, Price, Coupon Price, and FBA Price / FBM Price to investigate temporary discounts or longer-running price patterns. Read the series definitions carefully: Buybox Price includes shipping, while Price represents the lowest new-offer price excluding shipping. Compare the same series and time window before drawing conclusions.
Match the Data Cadence to the Decision
SellerSprite's update-frequency documentation distinguishes datasets that refresh on different schedules. Check the relevant feature rather than assuming one universal refresh interval. For urgent stock or offer changes, verify the operational state in your own systems and the current Amazon offer before executing a response.
Common Mistakes and Pricing Guardrails
Most avoidable mistakes begin with a mismatched definition or an untested assumption. Check the following points before connecting a tracking signal to a pricing or purchasing action.
Mistaking an Offer Change for a Seller Price Change
Check the seller and variation whenever a chart jumps. If the offer changed, preserve that event in the record instead of labeling the whole movement as a repricing decision.
Treating Stock Presence as Immediate Buyability
Physical units in a fulfillment network do not establish that the selected offer is purchasable. Check the available quantity and active-offer status before placing another purchase order to solve what may be a listing problem.
Using a Promotion Peak as the Permanent Demand Forecast
Separate ordinary in-stock demand from promotions and seasonal peaks. Recalculate coverage under a downside and upside demand assumption, and revisit the forecast when the price returns to normal.
Ignoring Pricing Rules During a Shortage
A competitor's unavailable offer is not permission for an arbitrary price increase. Amazon's Marketplace Fair Pricing Policy addresses misleading reference prices, prices significantly above recent on- or off-Amazon prices, and excessive shipping charges. Use current policy and pricing controls when reviewing any adjustment.
Confusing Monitoring With Repricing
Observing a price change and publishing a new price are separate actions. If you use a repricing system, review its minimums, maximums, promotion interactions, and exception handling independently. A tracker alert should not bypass your margin or stock checks.
The Bottom Line
Amazon stock and price tracking is useful when it connects three questions: what can you sell now, what will be available next, and what contribution will remain at the proposed price? Competitor history helps you interpret the market, but your own stock and cost records determine what the business can support.
Start with a manageable set of important SKUs, consistent offer comparisons, and clear action thresholds. The aim is not to react to every market movement; it is to reduce avoidable stockouts, unnecessary discounting, and replenishment decisions built on the wrong assumptions.
FAQs
What does Amazon stock and price tracking mean for sellers?
It means monitoring product inventory, offer availability, and selling prices over time to support replenishment, pricing, and advertising decisions. Own-account stock records support operational planning; competitor observations provide market context.
Can I see a competitor's exact inventory on Amazon?
Do not assume public availability or a tracker's quantity estimate reveals total inventory. Observation methods can be limited by order restrictions and the specific offer being checked. They should not be treated as complete warehouse records.
Why is my product unavailable when Amazon shows inventory?
Inventory may be reserved, unfulfillable, under investigation, or stranded without an active offer. Check the inventory status and buyability information before assuming the solution is replenishment.
Which price should I track?
Record a consistent offer basis: the selected product and variation, seller, condition, item price, and shipping. Record applicable coupons or membership conditions separately, and note the destination and timestamp. Distinguish a seller's own offer from the Featured Offer.
How do I calculate days of inventory coverage?
For a simple constant-demand estimate, divide available sellable units by expected daily unit demand. Use a relevant in-stock baseline, account separately for incoming supply, and revise the assumption when promotions or seasonality change demand. It is a forecast, not a guarantee.
Should I match every competitor price drop?
No. First confirm the comparison is valid, then calculate the contribution at the lower price and the unit increase required to offset the reduction. Consider stock coverage and demand evidence before deciding whether to test a change.
How often should I review stock and price data?
Set the cadence by risk. Promoted, fast-moving, or supply-constrained SKUs need closer attention than stable products. Check each source's refresh interval and timestamp so repeated checks are not mistaken for new observations.
References
- Amazon Seller Central: Inventory Buyability View
- Amazon Seller Central: Becoming the Featured Offer View
- Amazon: Inventory Management Techniques and Best Practices View
- Amazon Marketplace Fair Pricing Policy View
- Amazon: Best Sellers Rank Guide View
- SellerSprite: Product & Keyword Tracker Guide View
- SellerSprite: Product Research Quick Tips View
- SellerSprite: Data Update Frequency View
- SellerSprite: Keepa Alternatives and Amazon Price History View
- SellerSprite: Amazon Sales Estimator vs. Profit Calculator View
By SellerSprite Content Team
SellerSprite publishes practical guidance on Amazon product research, keyword analysis, and seller operations. This guide combines official documentation with illustrative inventory and pricing calculations.
Last reviewed: October 12, 2026