Meta description: A healthy ACoS can still hide an unhealthy business. Here's the exact way I calculate TACoS for client accounts, a real example of when a "high" number is actually fine, and how to start tracking it yourself this week.
I had a client account last month where a newly launched ASIN was being pushed aggressively. Total sales for the month came to about $19,000. Spend across Sponsored Products, Sponsored Brands, and Sponsored Display added up to roughly $4,000. TACoS on that ASIN: 21%.
If you only look at that number in isolation, 21% sounds high. Most sellers would panic and start cutting bids. But this brand aligns almost all its ASINs to a 20% TACoS target when going aggressive on a new launch, so 21% was actually right where it should be. Only about $1,650 of that $19,000 in sales was organic. The other 91% was ad-attributed, which is completely normal for a product that's still building its browsing history and hasn't earned organic rank yet.
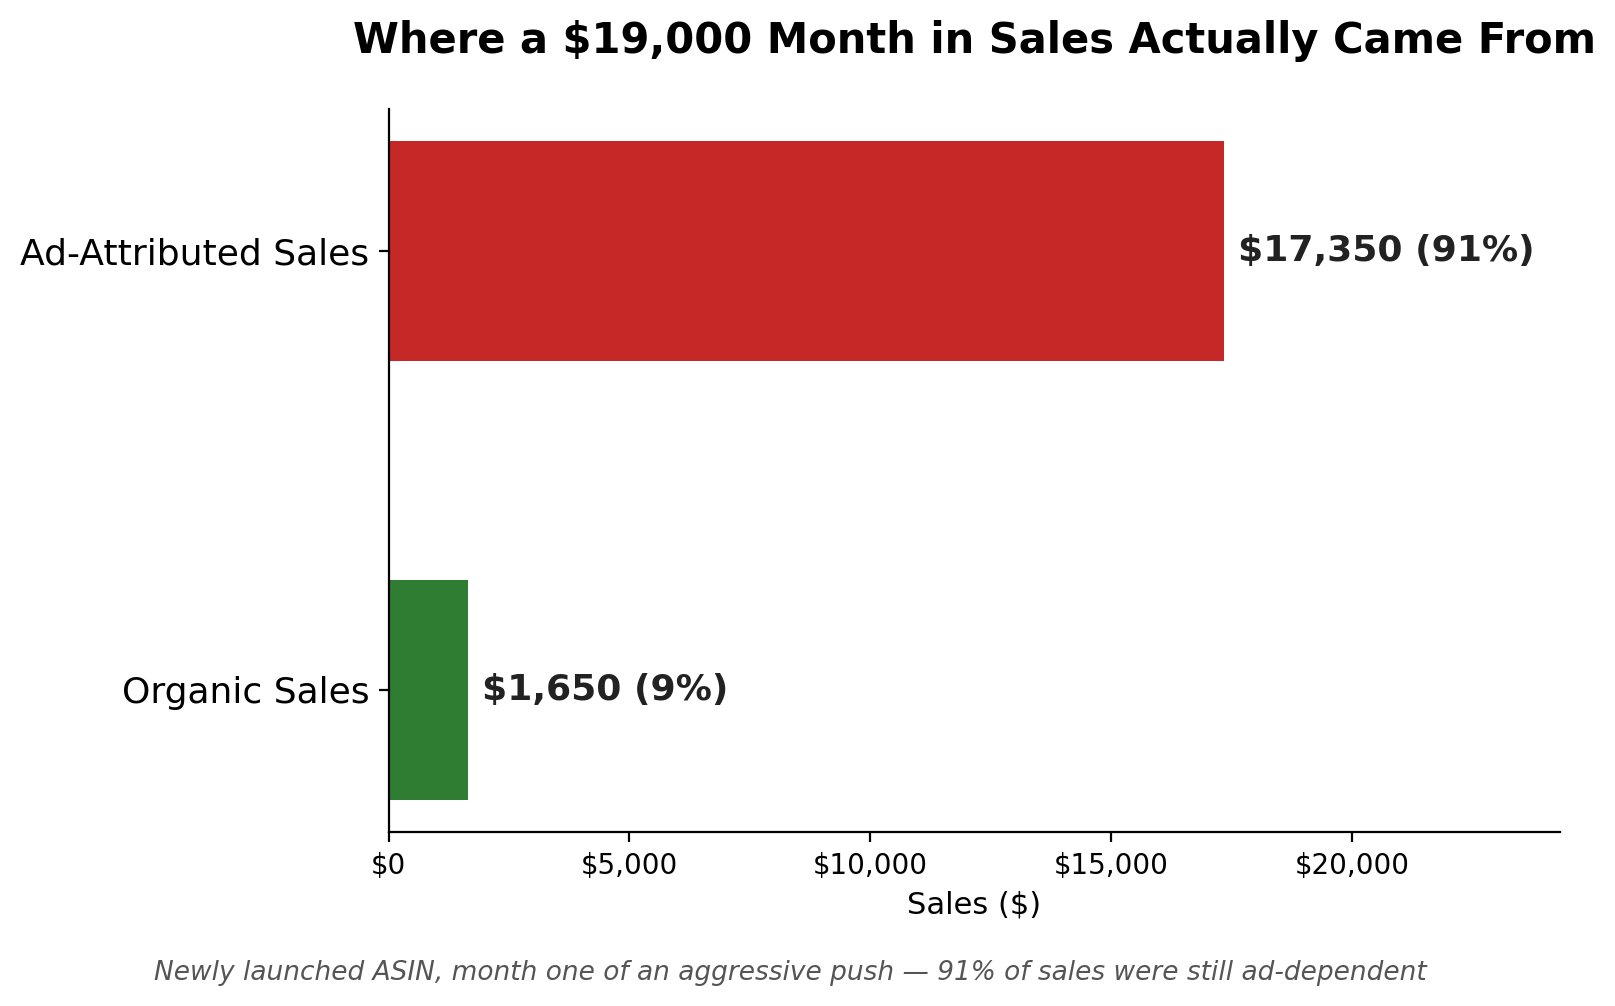
Here's the part that would have gotten missed if this brand only tracked ACoS: the individual ad type ACoS numbers looked fine too, 20% on Sponsored Products, 25% on Sponsored Brands, 17% on Sponsored Display. Every single number on the dashboard said "healthy." None of those numbers told us the product was 91% dependent on ads to sell at all. Only TACoS did.
That's the entire reason I tell every seller I work with to stop treating ACoS as the only number worth checking.
ACoS is a ratio, and a ratio only tells you half the story
ACoS, Advertising Cost of Sale, is simple: ad spend divided by ad-attributed sales.
ACoS = Ad Spend / Ad Sales
Spend $4,000 and generate $19,000 back through ad clicks alone, and your ACoS looks solid. But ACoS is a ratio of two numbers, and I have to maintain both of those numbers, not just the percentage between them. A campaign can show a beautiful 20% ACoS while the product it's advertising is completely dependent on that ad spend to sell a single unit. ACoS has no way of telling you that, because it was never built to look outside the ad account.
This is the mistake I see constantly, and it's not a beginner mistake either. Established sellers running 100+ orders a day fall into it just as often as someone three weeks into their first launch: caring only about ACoS and not TACoS. ACoS will not give you the full profitability picture. It was never designed to.
TACoS: not ad sale, total sale
TACoS changes exactly one part of the formula, and that one change is the whole point.
TACoS = Total Ad Spend / Total Sale (organic plus ad-attributed)
Total sale. Not ad sale. That's the entire distinction, and it's why the same $4,000 in spend against $19,000 in total sales gave us 21% TACoS instead of a flattering ad-only percentage. TACoS forces the organic side of the business into the equation, which is exactly the side ACoS was letting sellers ignore.
As a general benchmark across the brands I've worked with, TACoS should sit somewhere between 10-15% for a mature brand. But that's a starting point, not a rule carved in stone. Every brand should set its own alignment based on category, margin, and how aggressive the launch strategy is. The account above runs a 20% alignment for aggressive new launches specifically because they've decided that trade-off is worth it to build rank fast. Neither number is wrong. What matters is that you've actually decided on a number, instead of reacting to whatever ACoS happens to show you that week.
How to actually calculate ASIN-level TACoS
You don't need paid software to start. This is the exact three-step process I walk sellers through, and it takes five to ten minutes once you've done it once.
Step 1: Go to Seller Central, main menu, Reports, Business Reports, and open Detail Page Sales and Traffic by Child Item. Download it as a CSV for whatever date range you want your TACoS calculated over.
Step 2: Pull a bulk file from Campaign Manager's bulk operations, selecting Sponsored Products, Sponsored Brands, and Sponsored Display data. This is important: the date range on this bulk file has to match the exact date range you used in Business Reports, or your total sales numbers won't reconcile.
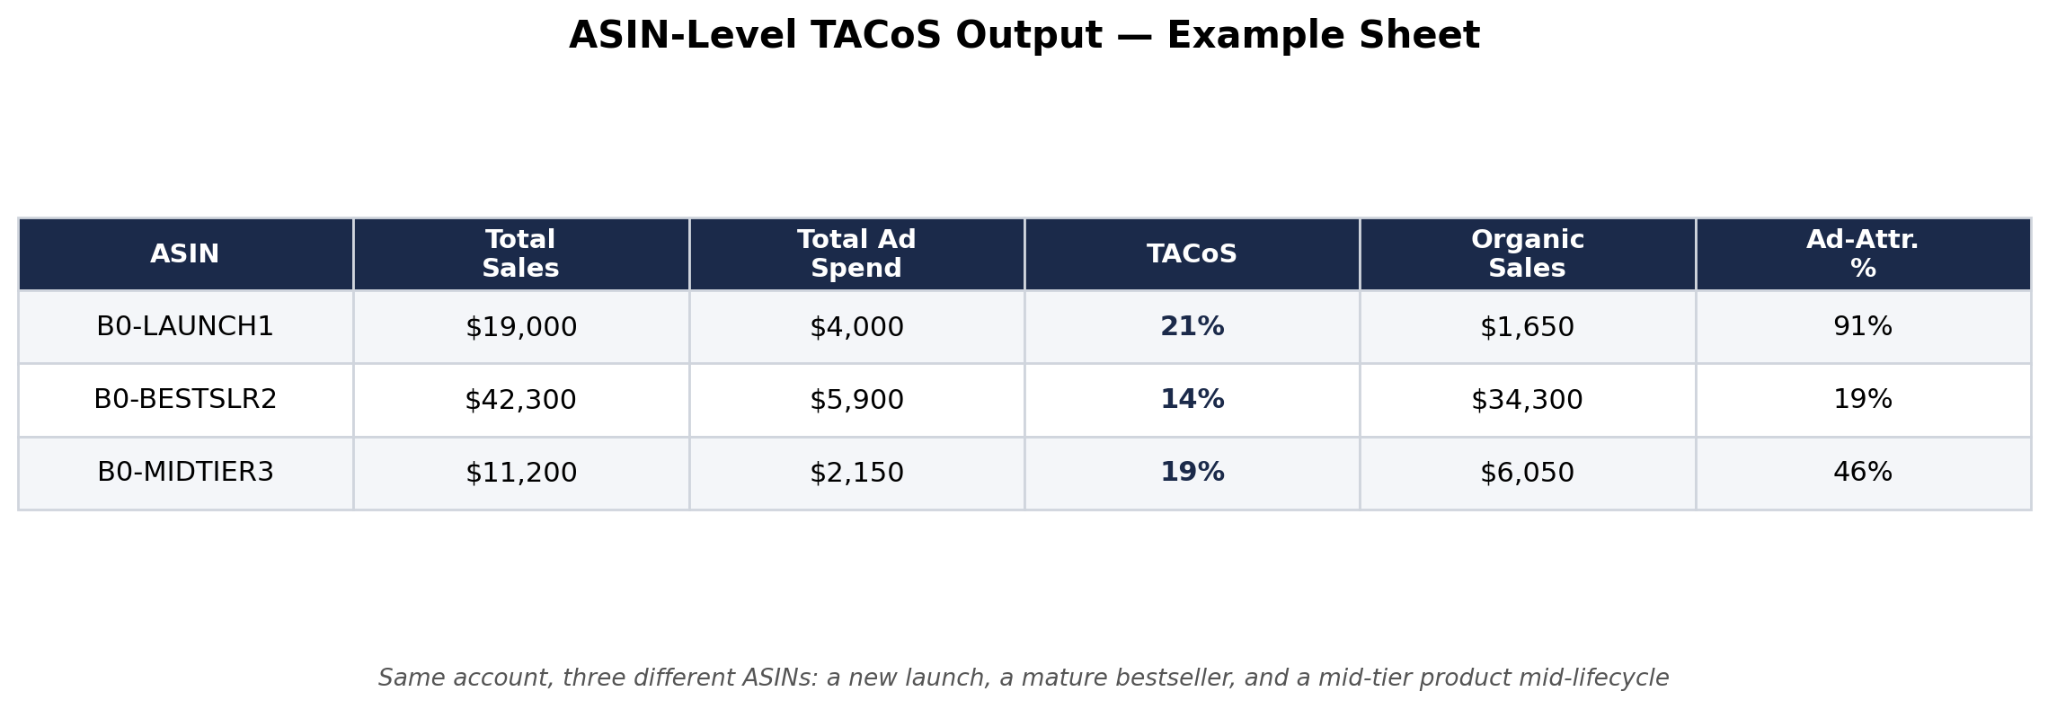
Step 3: Paste both into a Google Sheet. When you paste the bulk data, right-click and use paste special, values only, or the formatting will fight you. The output should give you, per ASIN: total sales, spend by each ad type, total spend, TACoS, sales by each ad type, ACoS by ad type, and the organic-versus-ad sales split.
Once that sheet is built, you'll immediately see which ASINs are healthy and which ones are quietly ad-dependent, and which ones are sitting on the opposite problem entirely.
Monitor it daily, but don't panic on one bad day
TACoS should be checked daily, not just once a month. But daily monitoring and daily overreacting are two different things. A day or two of TACoS spiking above your target is usually noise, a stockout, a slow organic day, a competitor running a deal. What actually matters is whether it stays above your alignment consistently across a stretch of days, not whether one Tuesday looked ugly.
The mistake sellers make once TACoS looks "too high"
Here's where I see the second-most-common error, right after ignoring TACoS entirely: seeing a high TACoS and immediately pulling back or pausing ads altogether.
Don't close on this. If you feel TACoS is too high, you optimize, you don't shut the campaign down. An ASIN that's 91% dependent on ads, like the launch ASIN above, is not a sign to panic and cut spend. It's a sign the product hasn't built enough organic browsing history yet to carry itself, and pulling ad support at that stage doesn't fix the dependency, it just kills the sales that were building that history in the first place. The fix is almost always to optimize the campaign structure and keyword targeting underneath the number, not to starve the number itself.
The flip side: when low TACoS means you're underspending
Everyone assumes a high TACoS is the problem to fix. In the same account as the launch ASIN above, a different, more established ASIN was sitting at only 19% ad attribution, meaning organic sales were carrying 81% of that product's revenue almost entirely on their own.
That's not automatically a win worth ignoring. An ASIN that low on ad dependence is usually a signal to advertise more, not less. Organic rank doesn't hold itself in place forever. If you stop defending a keyword position with ads, competitors bidding aggressively on the same real estate will slowly eat into the impression share your organic ranking earned, and that organic sales base you're relying on will erode with it. A low TACoS on a mature ASIN is an opportunity to protect and extend a lead, not a reason to assume the product no longer needs ad support.
This is the piece that gets missed when sellers treat TACoS as a single pass or fail line. The same account can have one ASIN that needs to pull back and optimize, and another ASIN sitting right next to it that needs the opposite: more spend, not less. Reading TACoS at the account level blends both of these signals into one flat number and hides the decision entirely.
For most sellers, spending money on ads was never really the problem. Knowing whether that spend is generating a positive return is the actual problem, and that's a per-ASIN question, not an account-wide one.
Two habits that quietly wreck your TACoS reading before you even get to it
Even when sellers do calculate TACoS correctly, two execution habits usually distort what the number is actually telling them.
Making changes to campaigns on a daily basis. Your data is not mature enough to act on every single day. If you're adjusting bids or pausing keywords daily based on a TACoS or ACoS blip, you're reacting to noise, not signal, and you'll never actually see whether last week's change worked before you've already made three more.
Letting your good performing campaigns run out of budget. This one costs sellers real money without them realizing it. If a campaign is converting well and hits its daily budget cap by noon, every impression and sale it could have picked up for the rest of the day is gone, and that lost organic-building traffic shows up later as a worse TACoS trend on that ASIN, even though the actual problem was a budget setting, not the product or the keywords.
Fix both of these before you start second-guessing your TACoS number. Half the time, a "bad" TACoS trend is really just one of these two habits quietly working against the account.
Where competitor and keyword research fits into this
None of this TACoS math tells you why an ASIN's organic side isn't growing. That's a separate question, and it's exactly where good product and keyword research earns its keep. If you're already using SellerSprite's product and keyword research to find where the demand and competition sit for your category, pair that research with your TACoS trend per ASIN. A product ranking well for its target keywords should show TACoS drifting down over time as organic picks up the slack. If the keyword rank is improving and TACoS still isn't moving, the ad structure itself usually needs work, not the research behind it.
The research tells you where to aim. TACoS, paired with real per-SKU margin, tells you whether aiming there actually made you money. If you want a fast gut check on one ASIN before building out the full sheet above, running it through Sellerview.ai's free Amazon FBA profit calculator gives you a quick per-unit margin number in about two minutes. That second half, real margin tracked alongside TACoS, is the exact gap I built Sellerview.ai to close, pulling ASIN-level TACoS and true profit after fees, ad spend, and COGS into one view instead of two separate spreadsheets you have to reconcile by hand every month.
The bottom line
ACoS is a ratio of two numbers, and I have to maintain both of them, not just the percentage in between. TACoS is what actually shows you whether a product's sales are standing on its own or being propped up entirely by ad spend, and it's the only number in the account that answers that question honestly.
Pull your Business Reports and your bulk campaign data this week, run the three-step calculation above on your top three ASINs, and set your own alignment target for each one based on where they sit in their lifecycle. A brand new launch going aggressive can justify a higher number than a five-year-old bestseller coasting on reviews and rank, and pretending both should hit the same target is where a lot of sellers talk themselves into the wrong decision. Then keep checking it daily, without treating every single day's number as gospel. That's the whole system, and it's the same one I run on every account I manage.
Himanshu Gaba is the founder of Sellerview.ai, a profit analytics platform helping Amazon FBA and FBM sellers see their true margin after fees, ad spend, and cost of goods, not just their revenue. With 7+ years managing Amazon advertising accounts across 300+ brands, he writes and speaks regularly about Amazon seller profitability, PPC efficiency, and margin tracking.